Ideas
Industry Media
TV Advertising Hits a New Fault Line as Election Demand, Sports Costs and Measurement Disputes Collide
Political and sports spending is strengthening television’s value while intensifying inventory, pricing and cross-platform measurement problems.
Political demand and sports pricing are strengthening television advertising while unresolved measurement differences complicate how broadcast, cable and streaming inventory is valued.
Television’s fall advertising market is entering a high-pressure period: record-setting political demand is crowding inventory, premium sports are raising prices, and buyers still cannot reliably compare audiences across broadcast, cable and streaming.
AdImpact’s June forecast put 2026 political advertising at $11.6 billion, including $5.6 billion for broadcast, $2.6 billion for connected TV, $1.4 billion for cable and $88 million for satellite. The 2022 midterms generated $8.9 billion. Jesse Contario, MiQ’s regional vice president for the Southeast and political, told Digiday that 2026 is positioned to become a record midterm cycle. MiQ’s analysis found October represented 46% of CTV political spending during the 2024 cycle, with half of that October spending going to advertising-supported streaming services. (digiday.com)
The surge creates competing consequences. Broadcast stations and CTV platforms can sell scarce inventory at stronger rates, but political displacement, makegoods and complex FCC-governed pricing make campaigns harder to execute. Todd Novick, vice president of political at AI Digital, said linear buyers face rising rates and diminishing returns from paying more for many of the same programs. Stuart N. Brotman of The Media Institute argued that campaigns increasingly need blended packages combining linear television’s reach with CTV’s voter-file and ZIP-code targeting. (tvnewscheck.com)
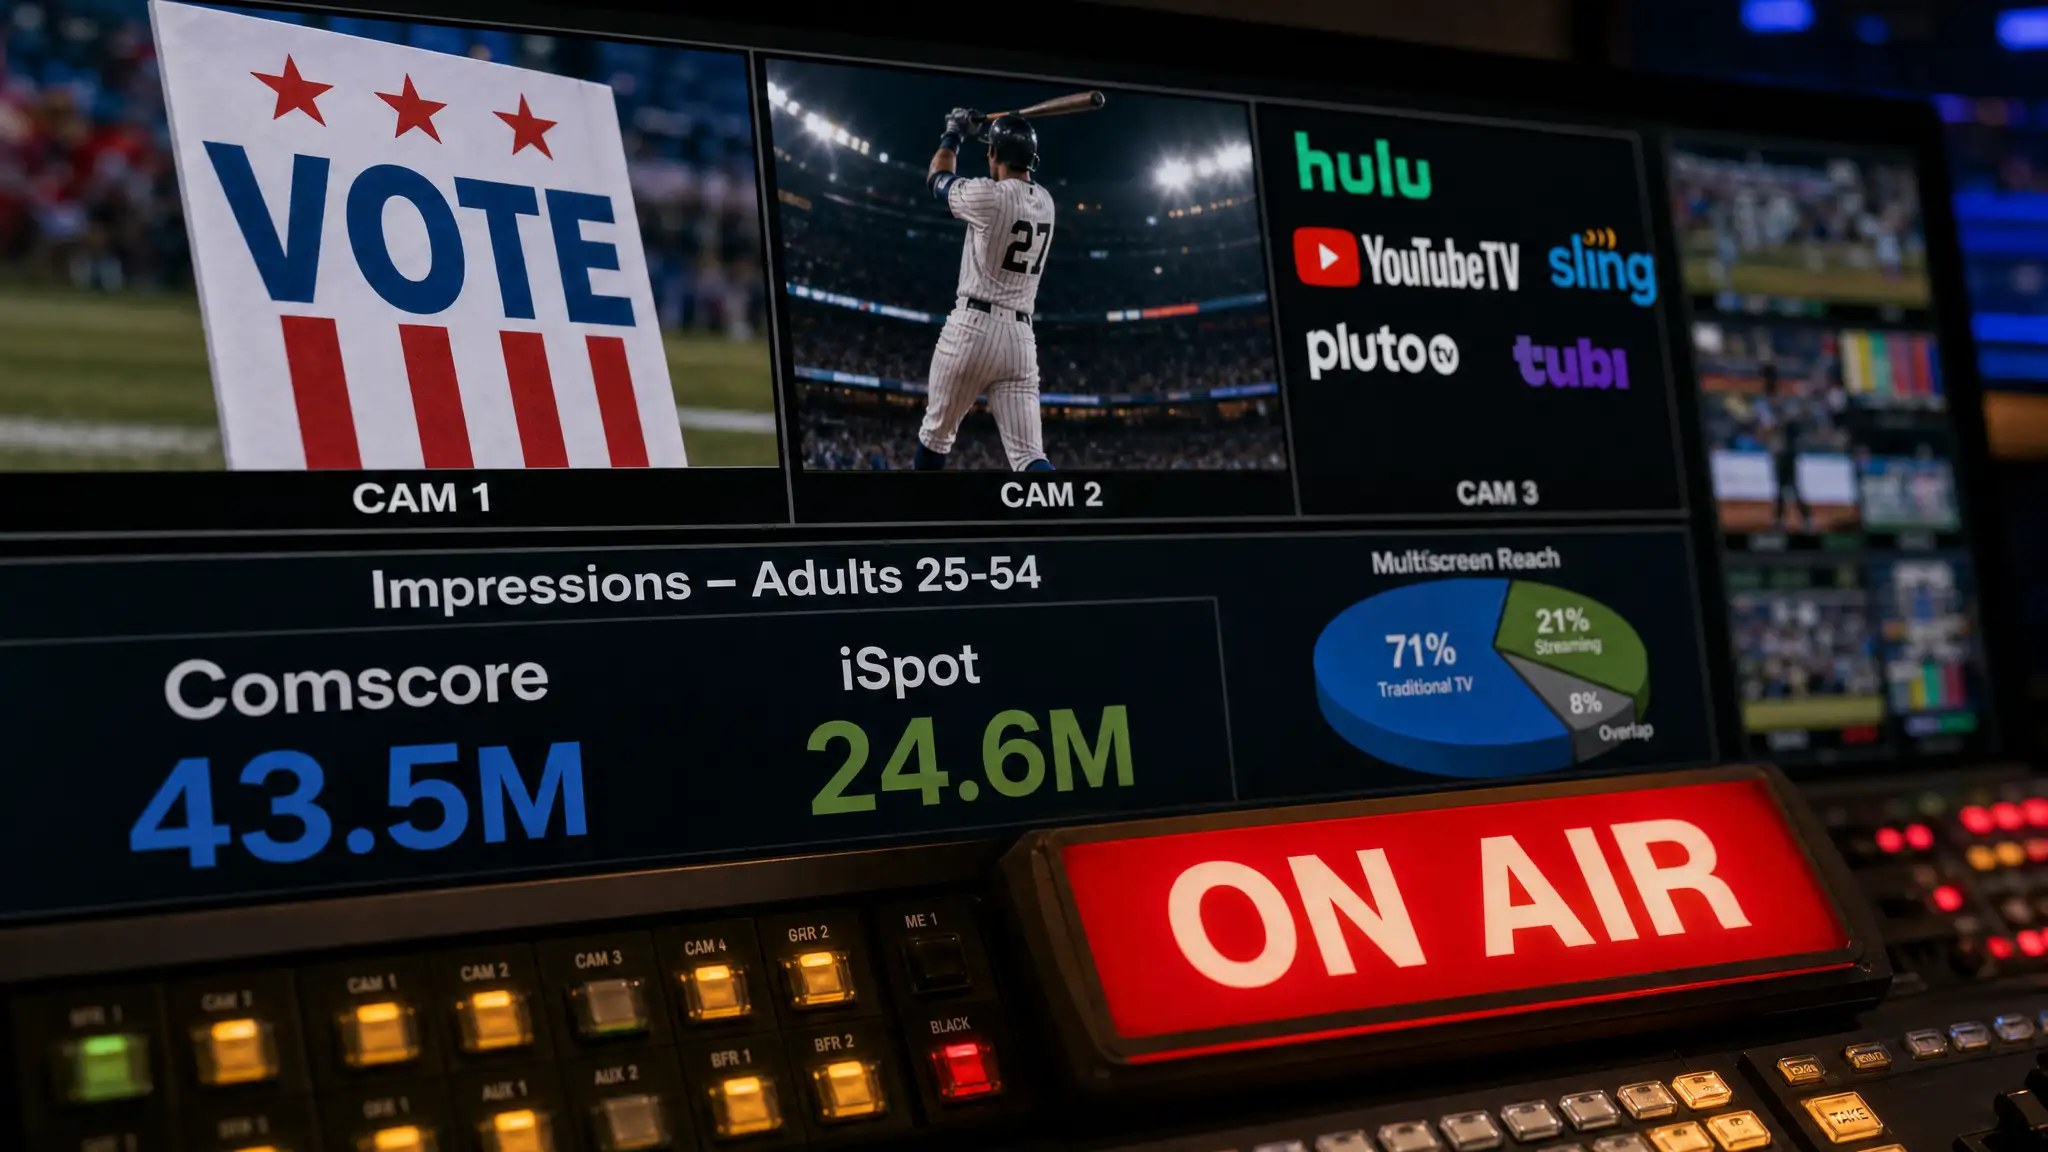
Sports adds another pricing pressure. iSpot estimated that Major League Baseball’s 2026 regular season produced $241 million in national television advertising across Fox, NBC, ESPN, MLB Network and YES Network. Comcast Advertising separately reported that multiscreen campaigns combining traditional and streaming TV generated twice the incremental return on ad spending and 2.4 times as many website visits as single-screen campaigns. Its research attributed 71% of unique multiscreen reach to traditional TV and 21% to streaming, with 8% overlap. (tvnewscheck.com)
Yet the industry is disputing the numbers used to value that reach. Warner Bros. Discovery compared VideoAmp, iSpot, Comscore, Innovid and Samba across more than 50 linear and streaming campaigns. For one financial advertiser, Comscore counted 43.5 million impressions among adults 25–54 while iSpot counted 24.6 million. David Porter, WBD’s head of advertising research, data and insights, called for standardized impression and viewability rules plus clearer disclosures. (adexchanger.com)
ConsumerEXP analysis: Television’s competitive advantage is no longer simply audience scale. Sellers must combine broadcast and streaming inventory while proving—under common, transparent definitions—that advertisers received the reach and outcomes they purchased.
Footnotes
Articles used to create this Fact Brief
- The Immutable Gravity Of The 30-Second Spot: Why TV Still Rules The 2026 MidtermsTVNewsCheck
- New WBD Report Makes The Case For Getting The Measurement Basics RightAdExchanger
- Media Buying Briefing: With so much at stake, midterm election spending is insaneDigiday
- Major League Baseball September TV Ad Rates Increase In Preparation For PlayoffsTVNewsCheck
- Multiscreen TV Ad Campaigns Double Incremental Return On Ad Spend, Says ComcastTV Technology
Continue reading